
$2,669,000
About this home
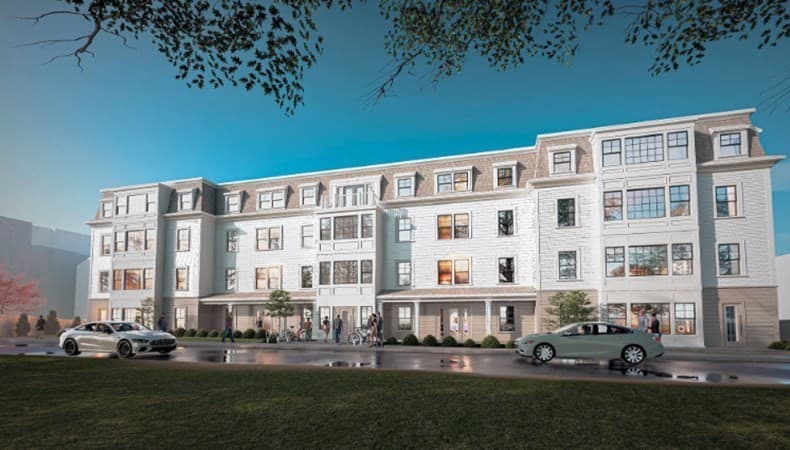
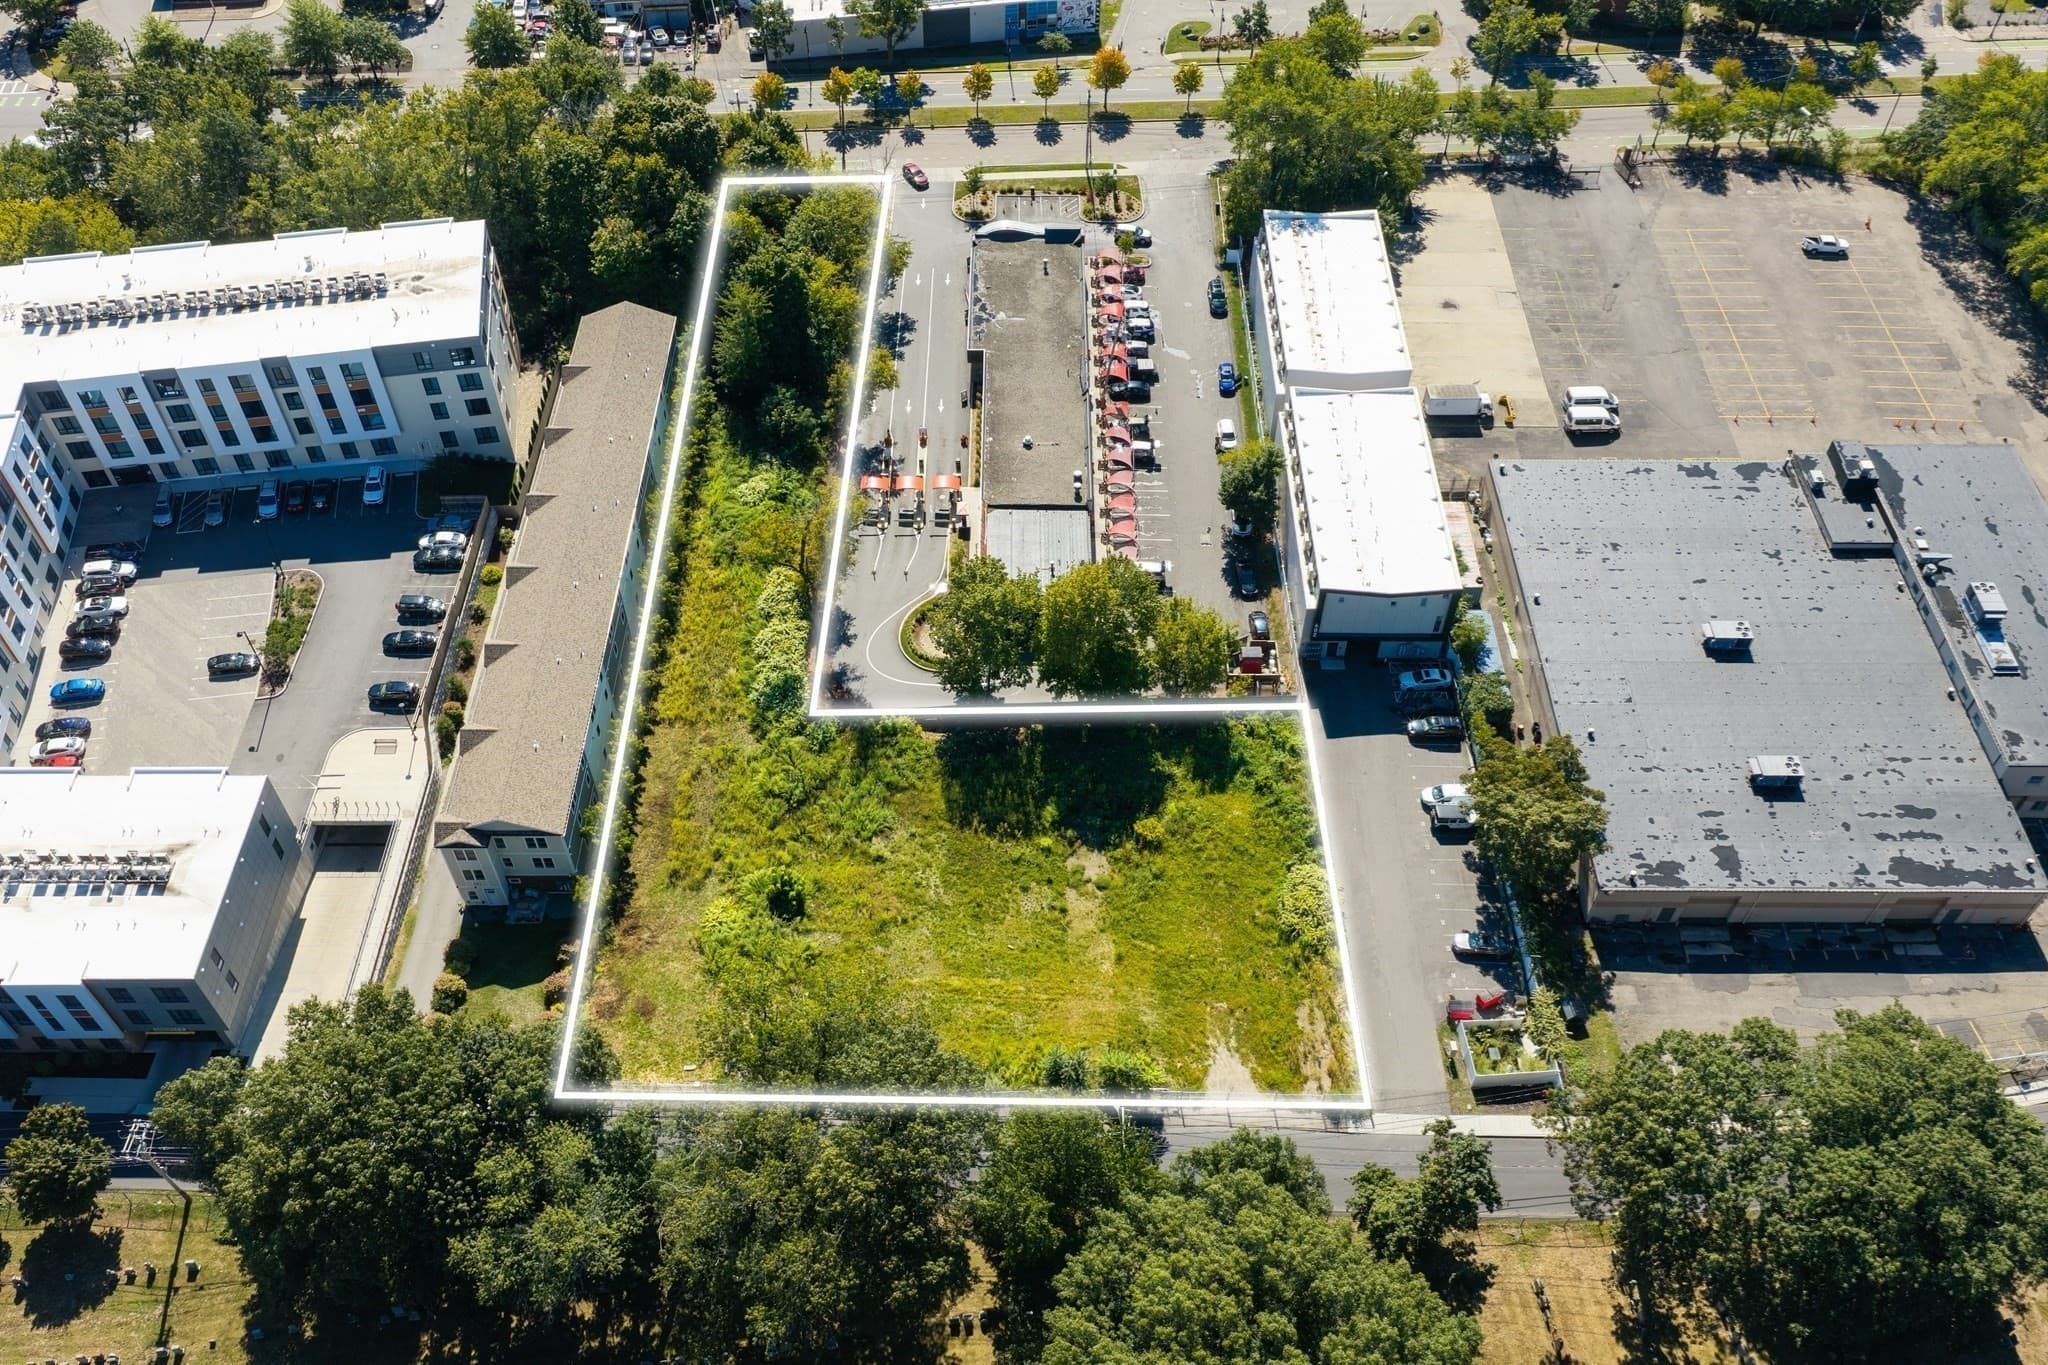
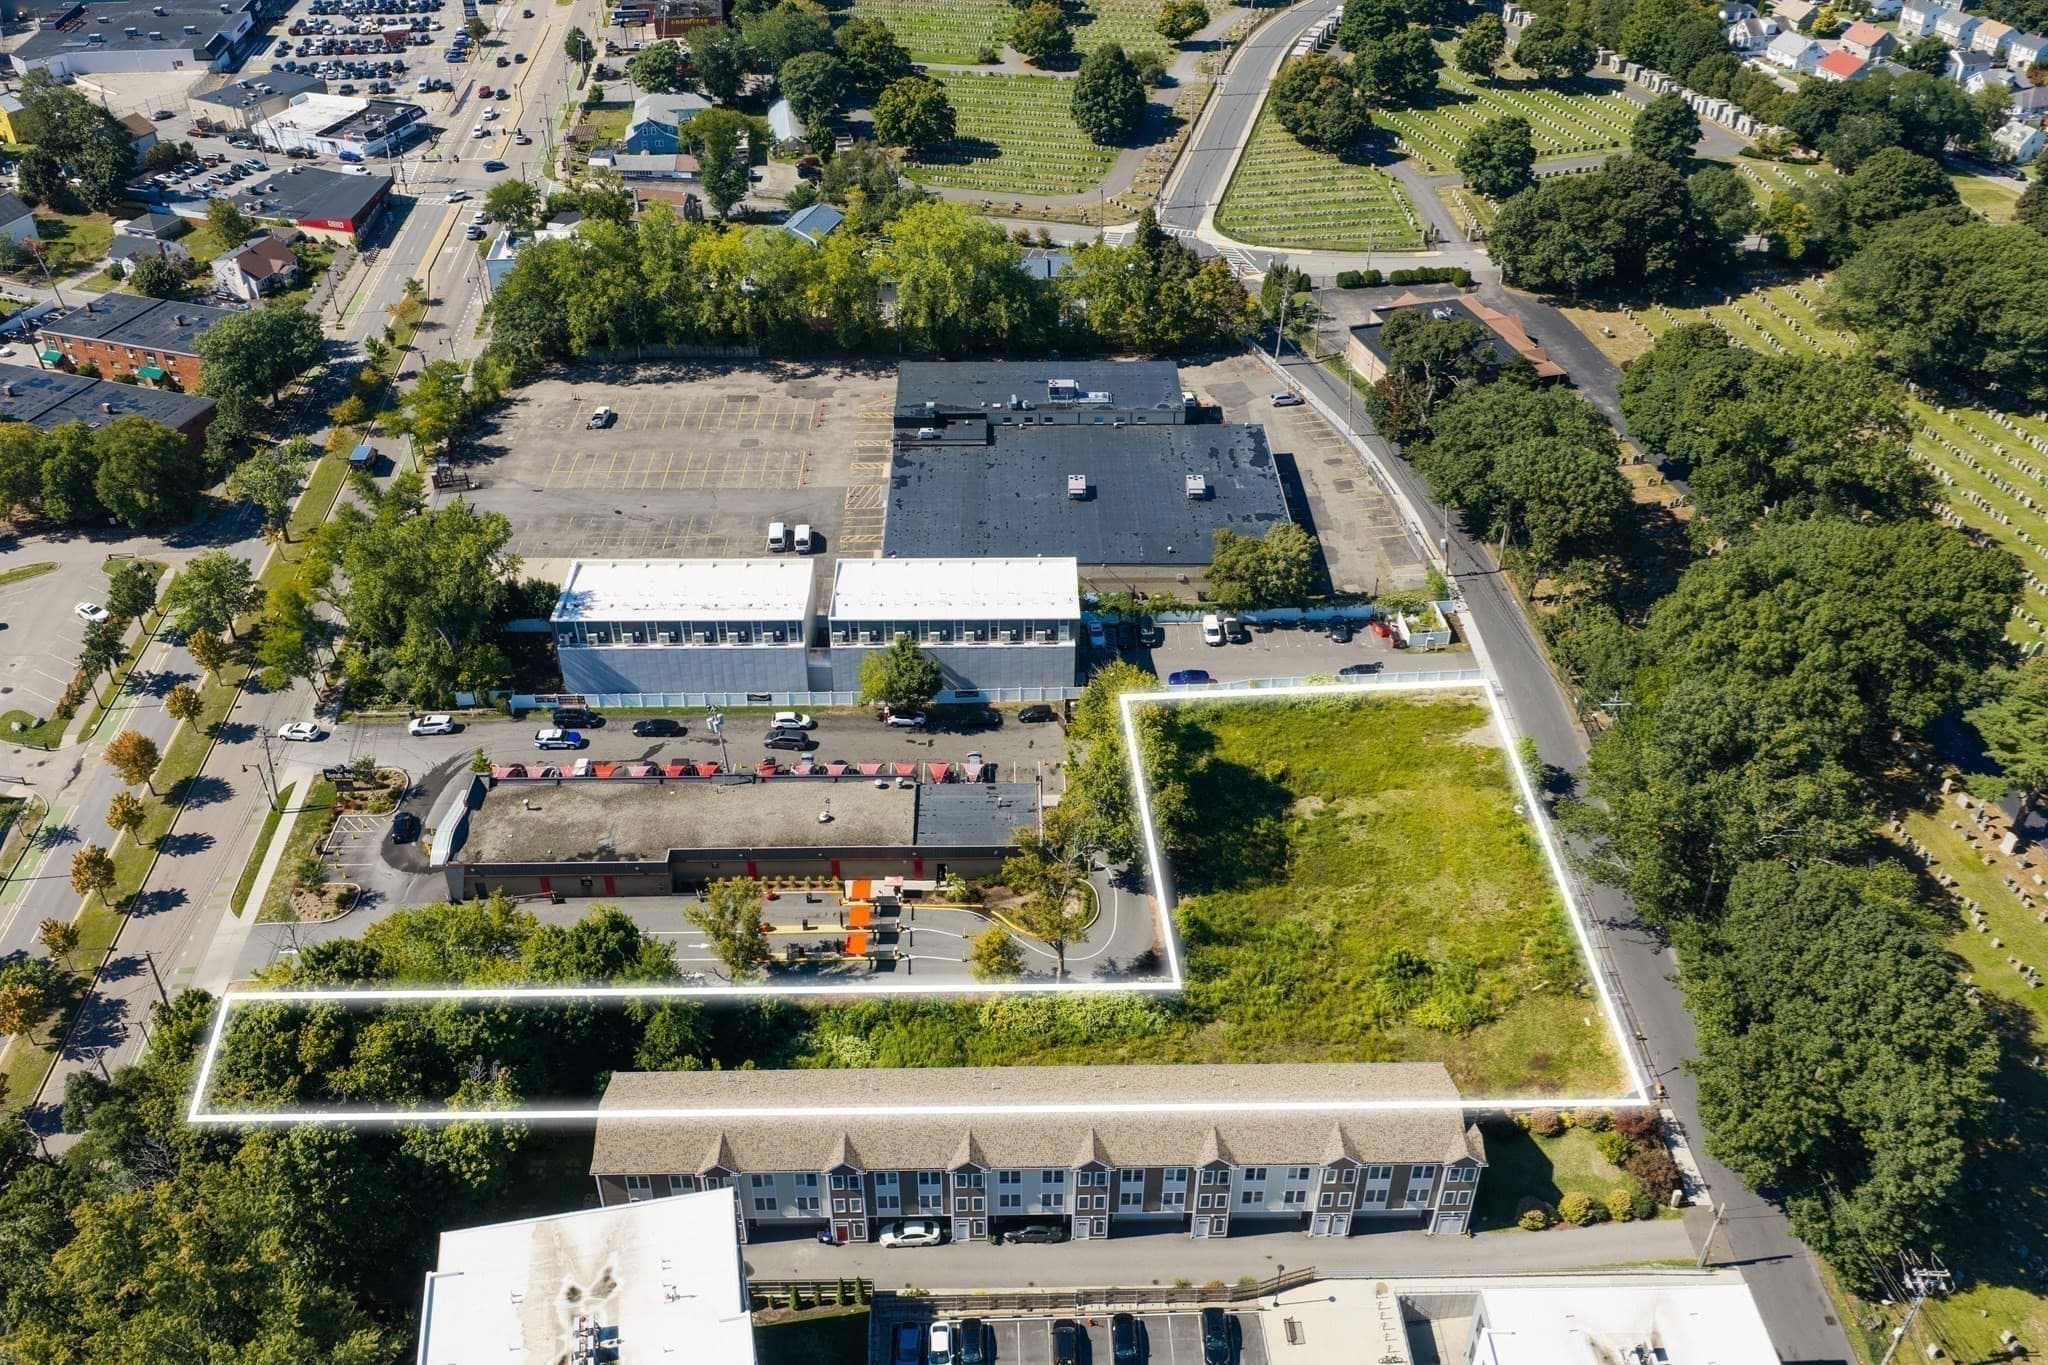
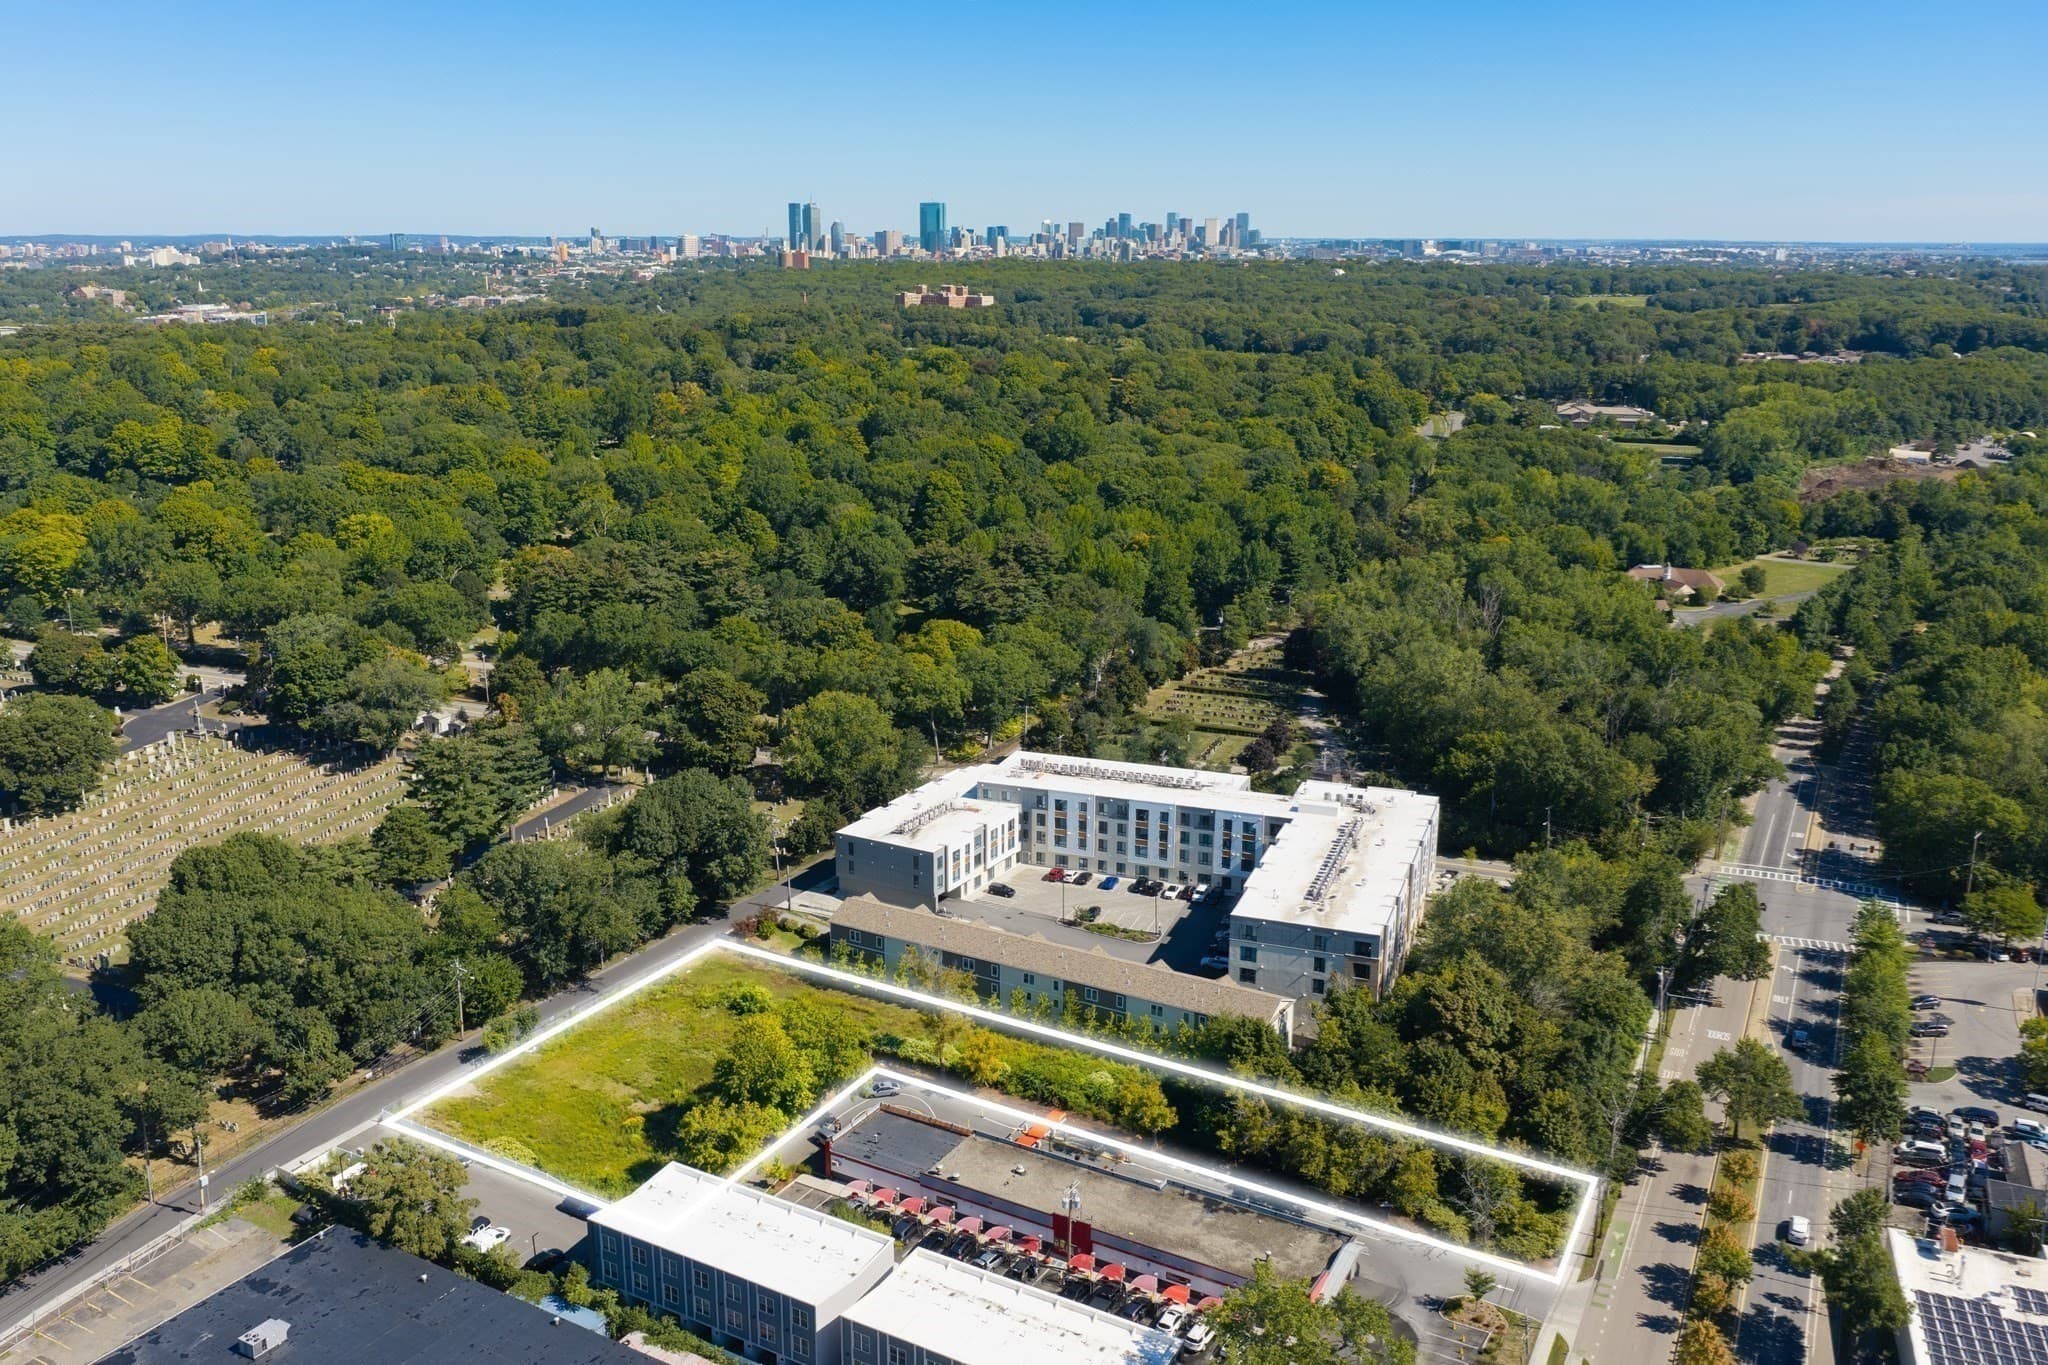
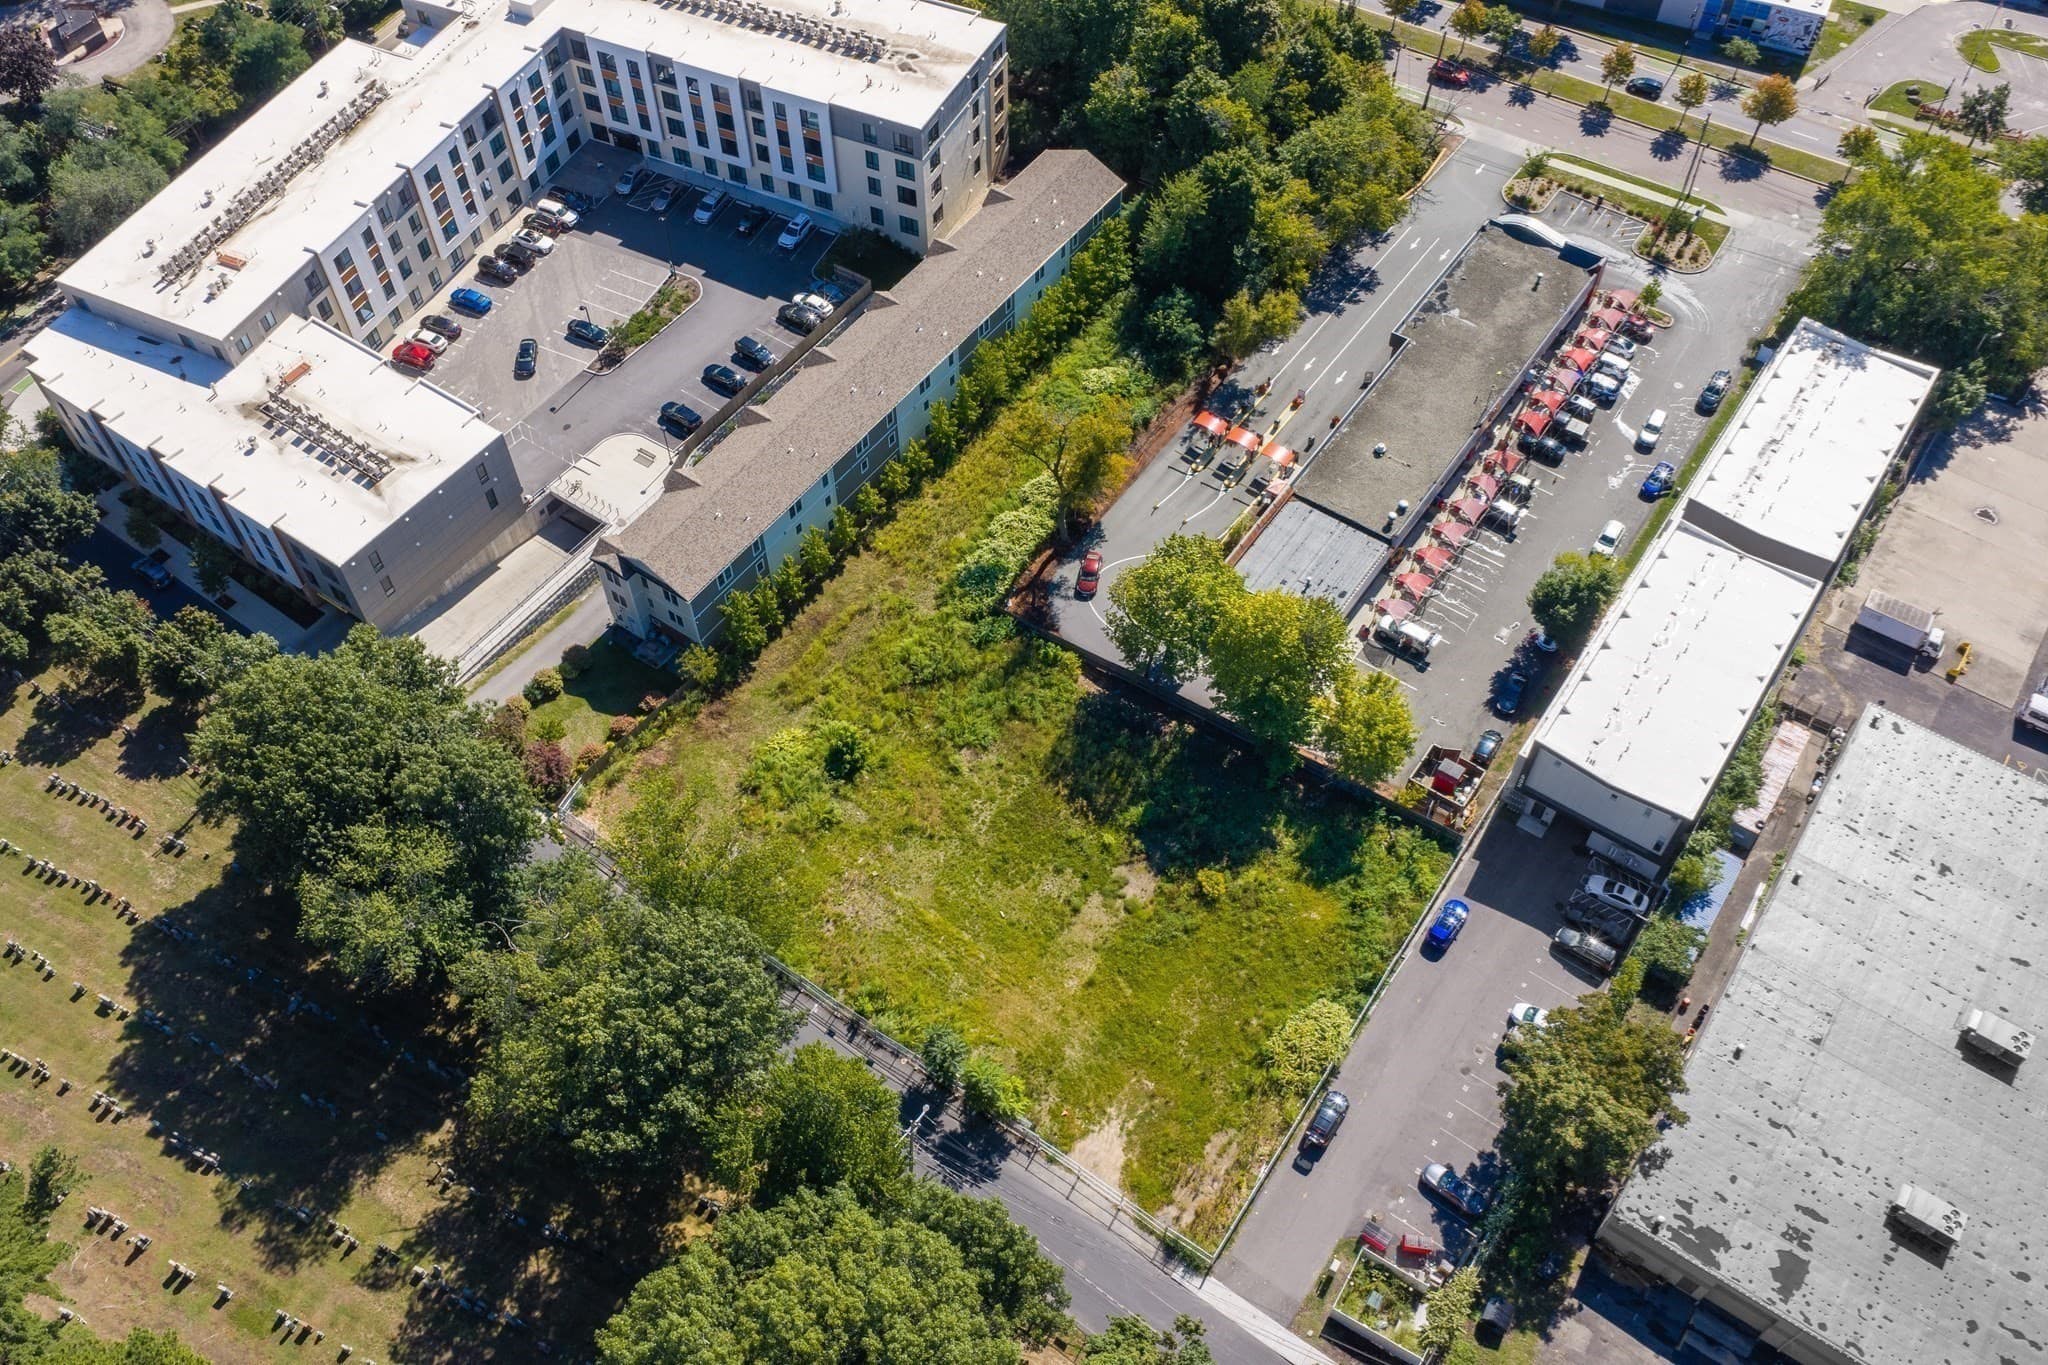
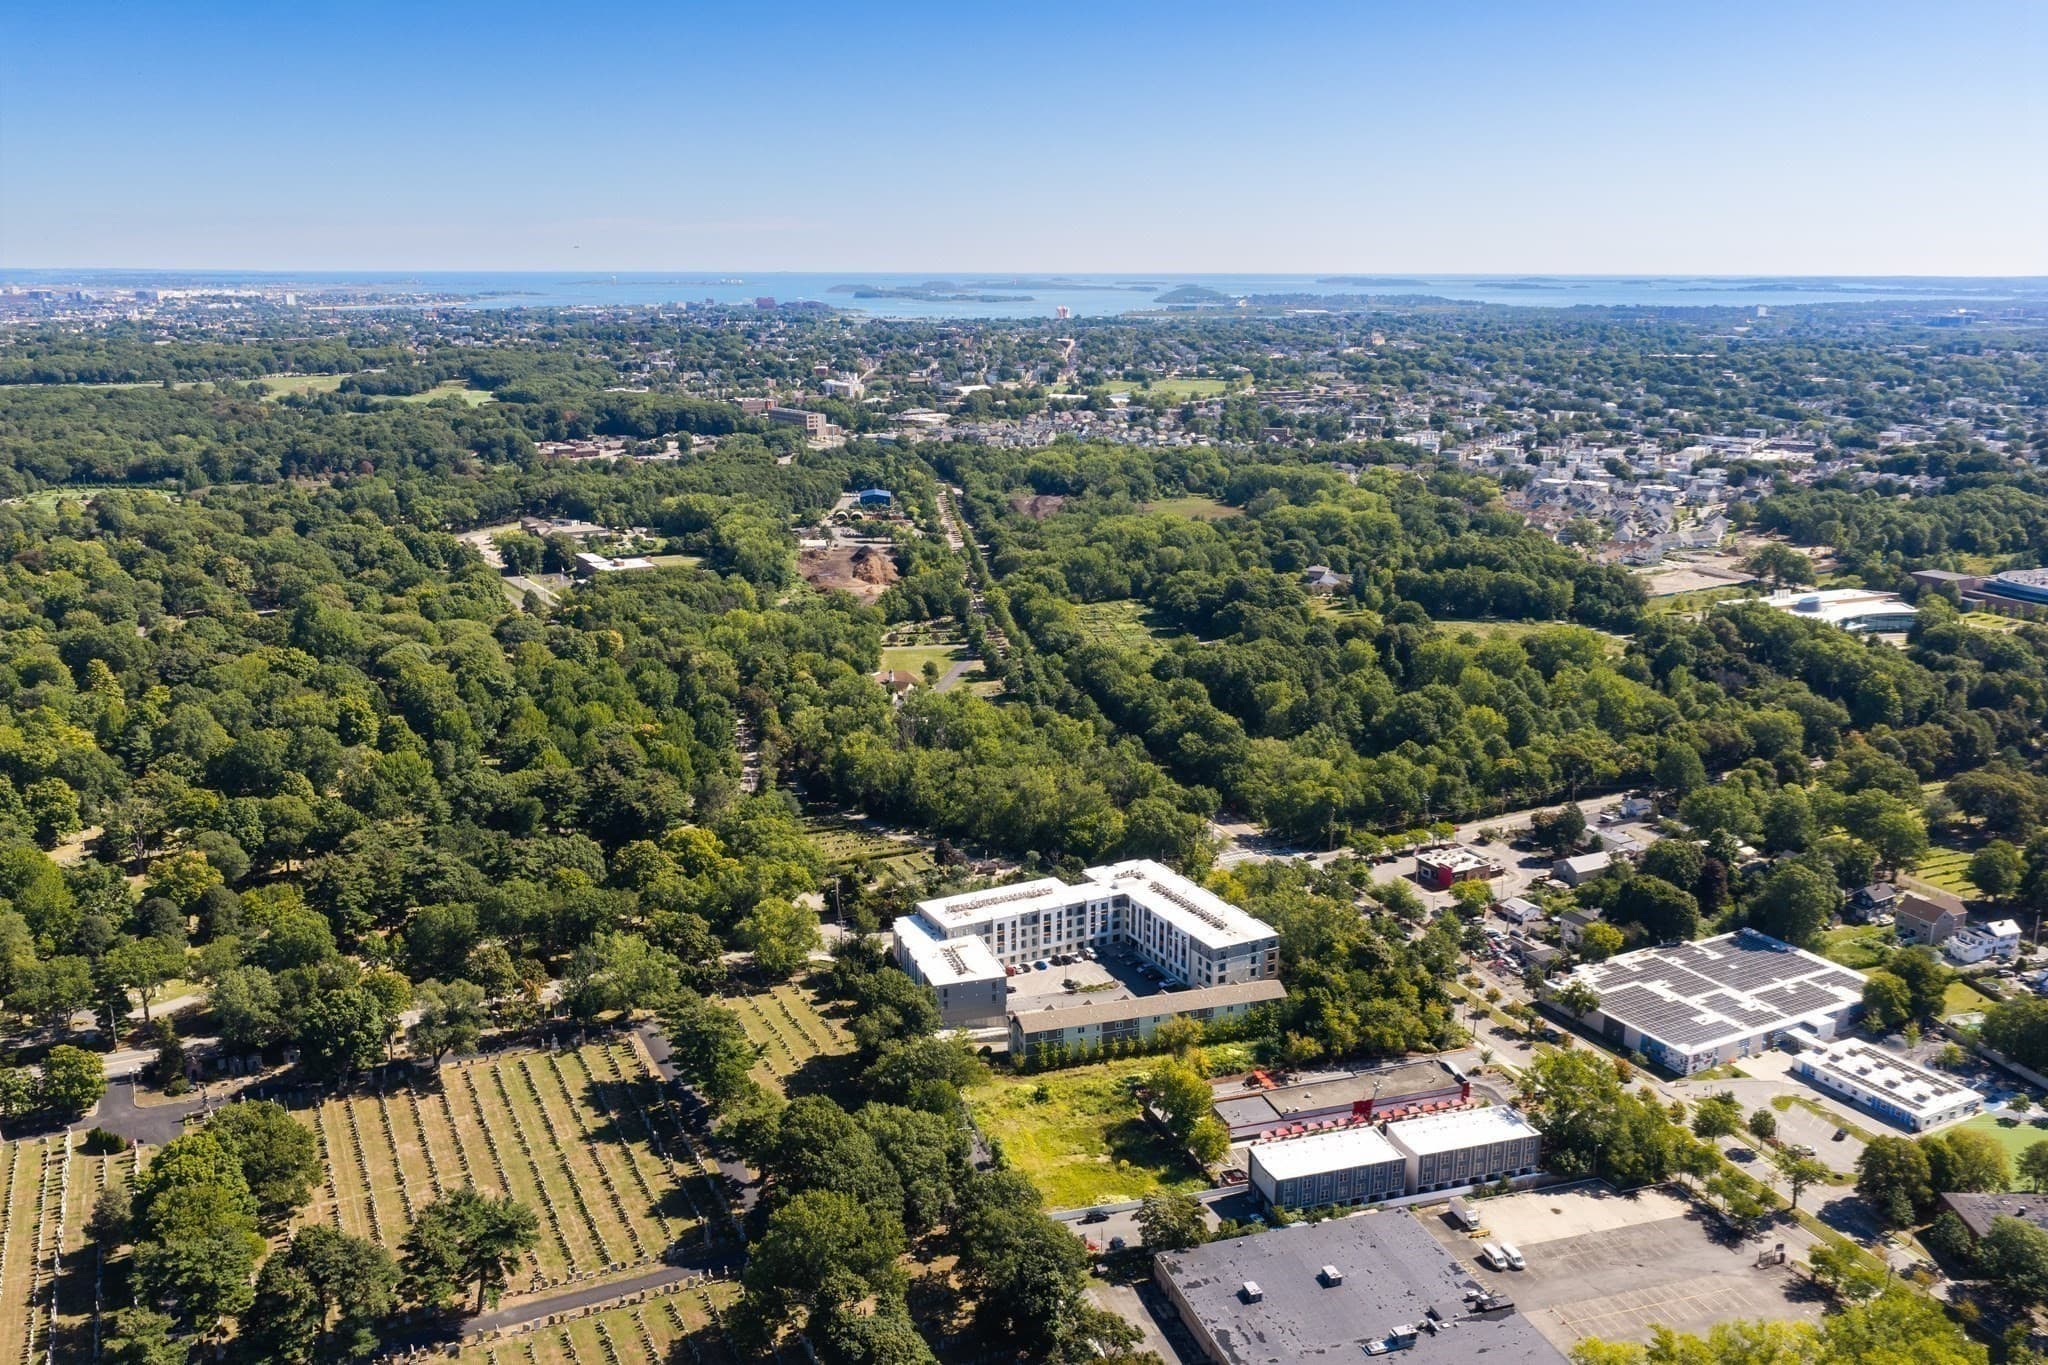
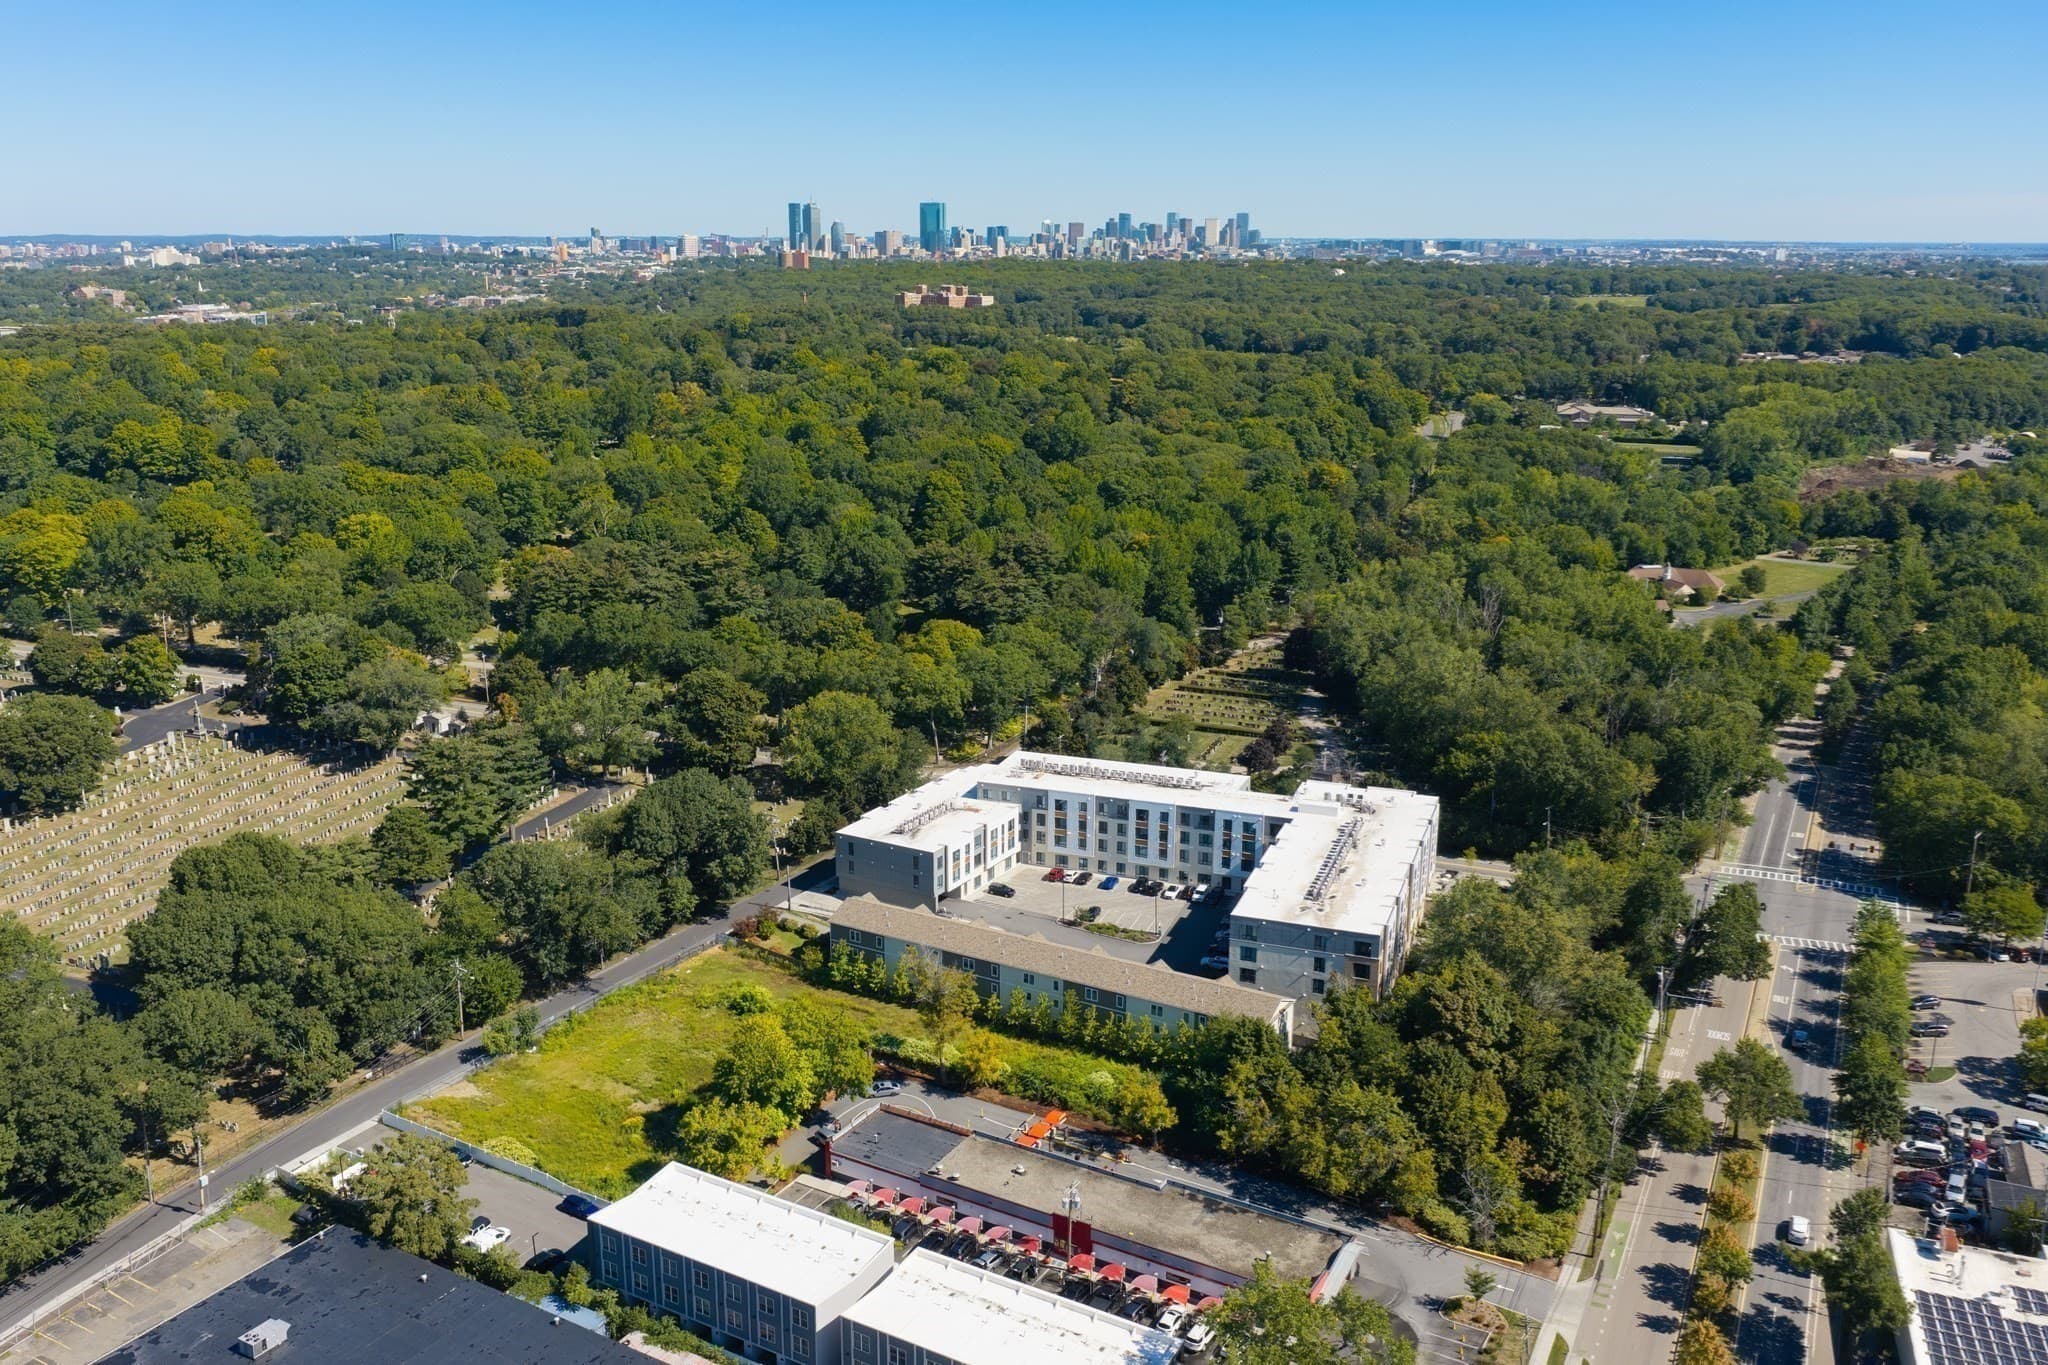
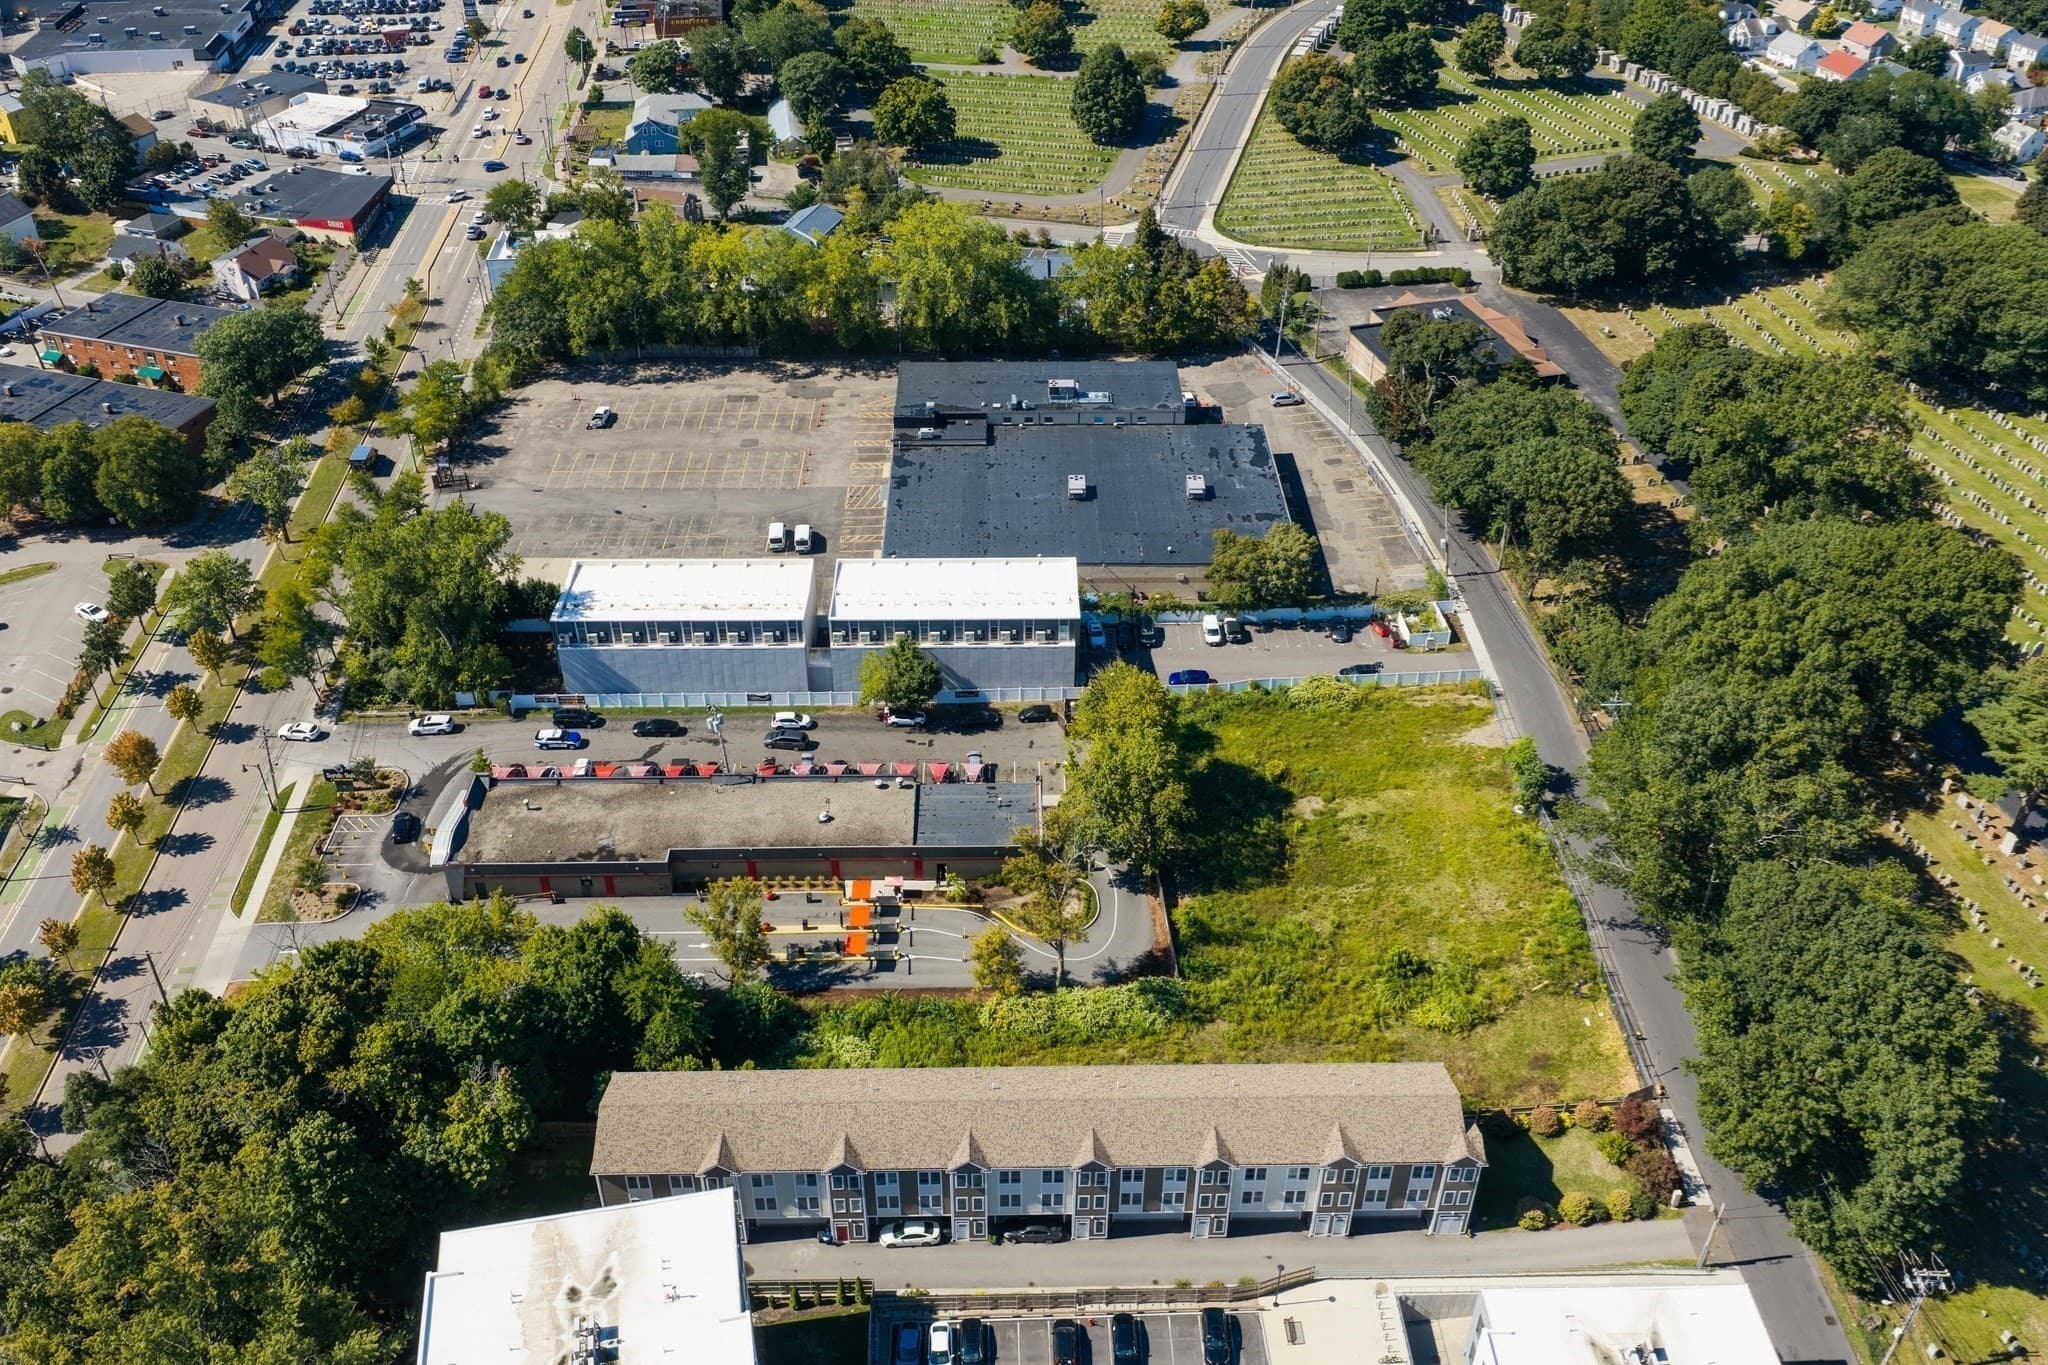
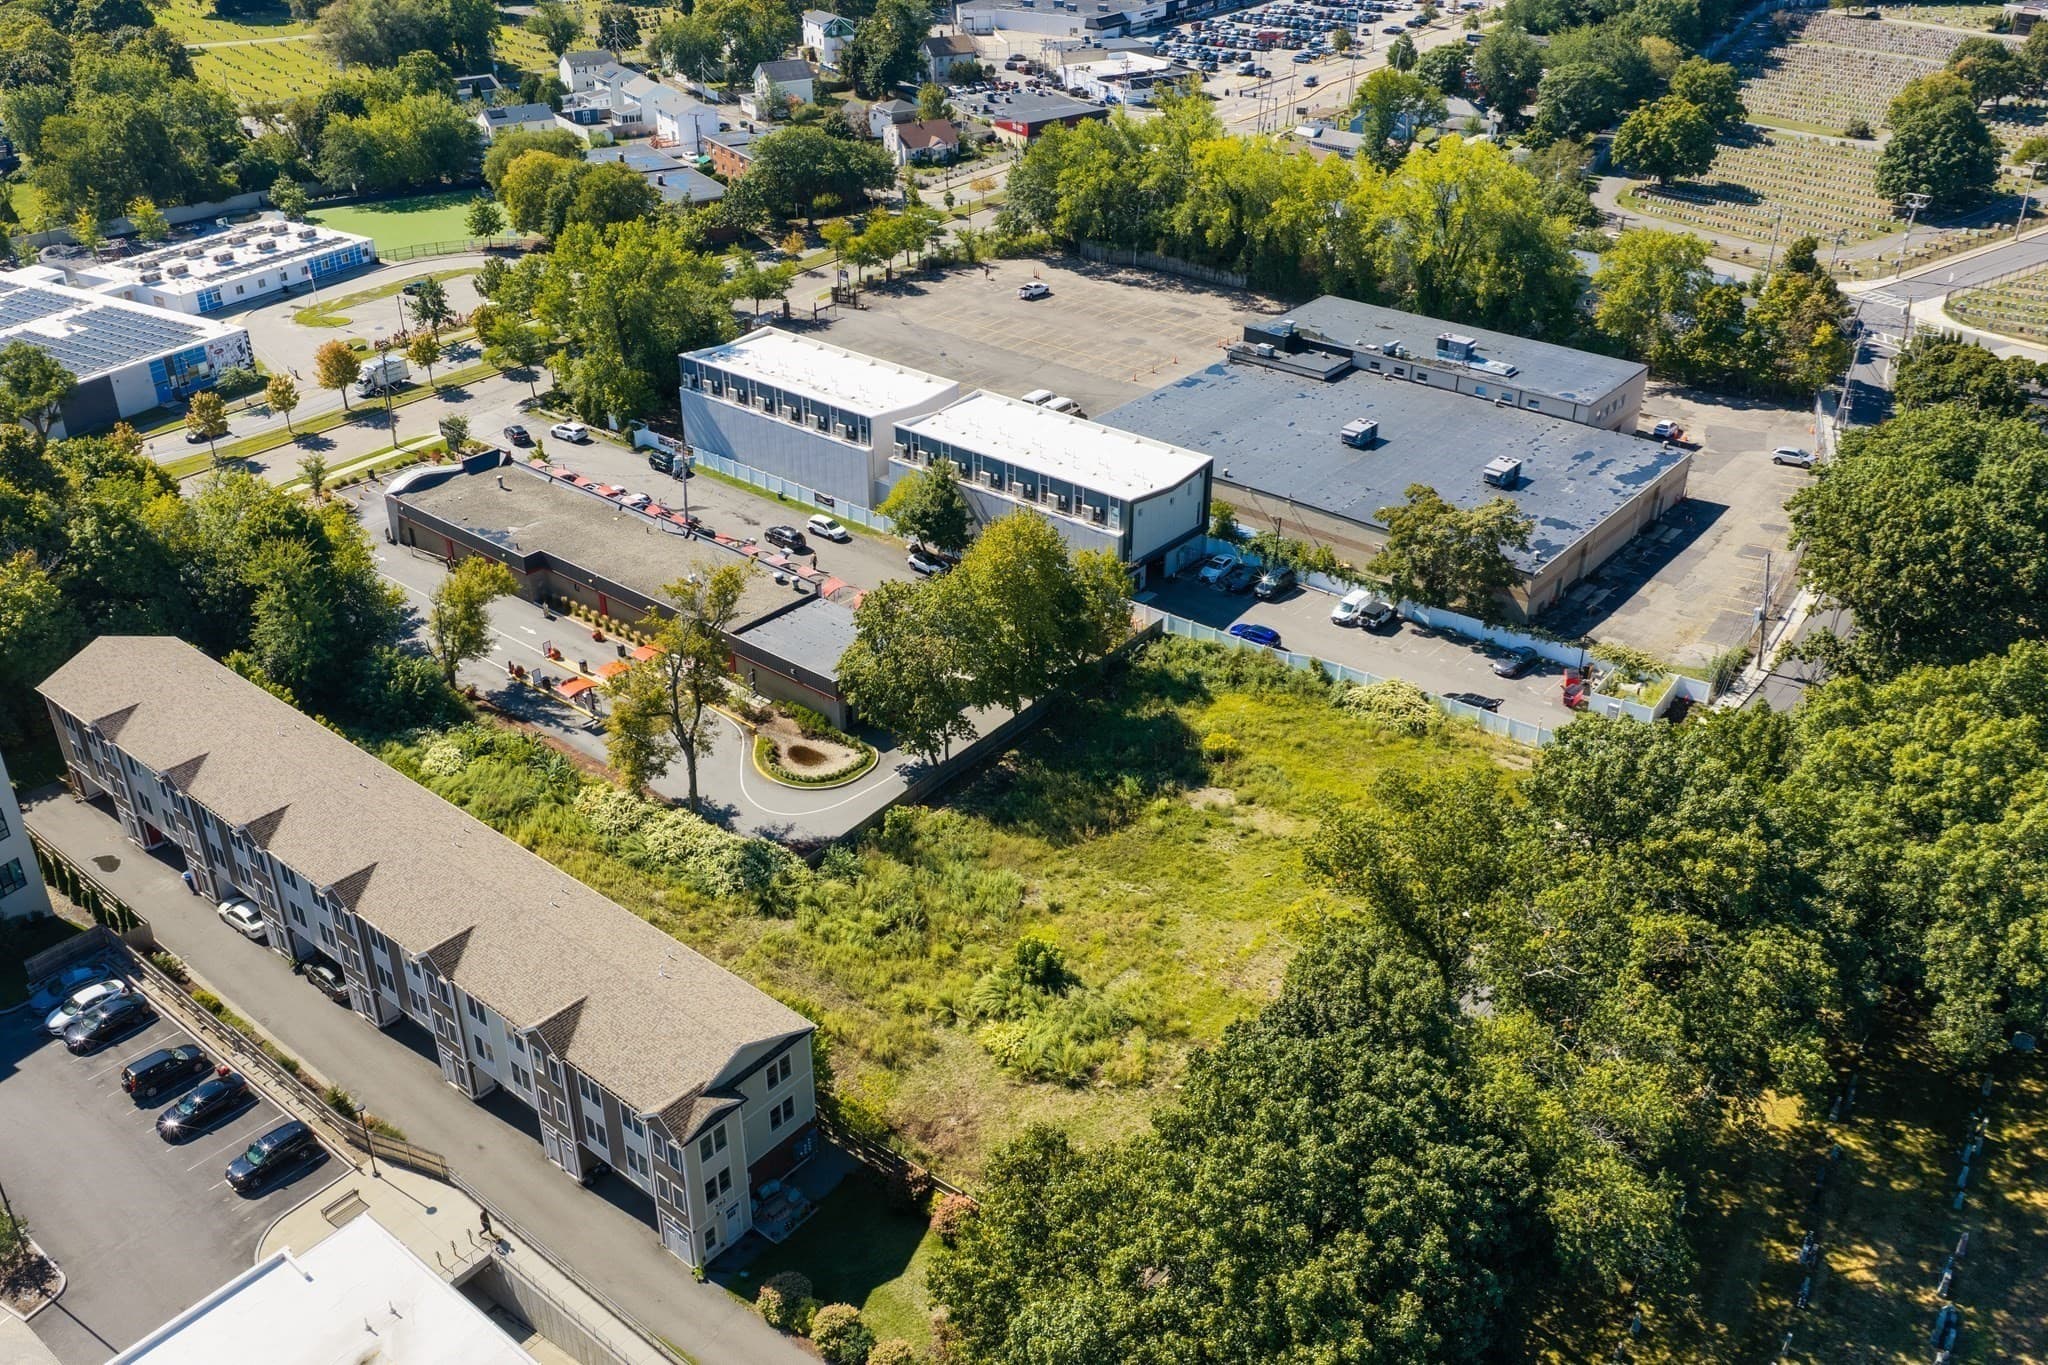
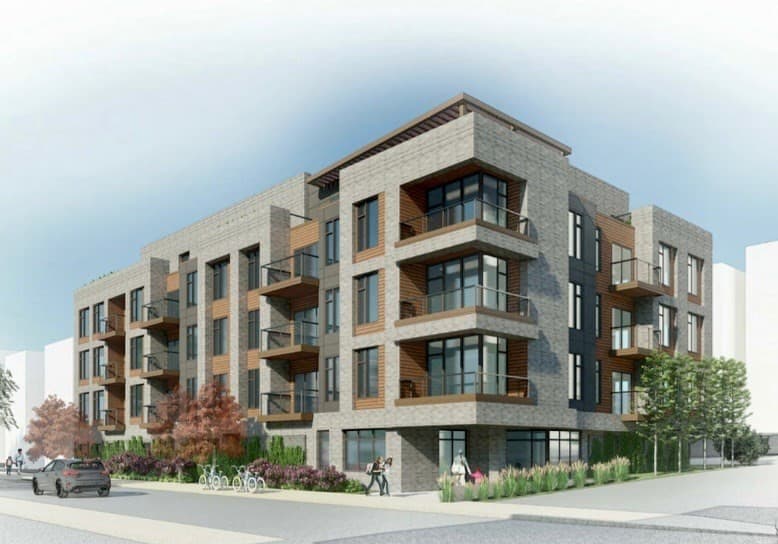
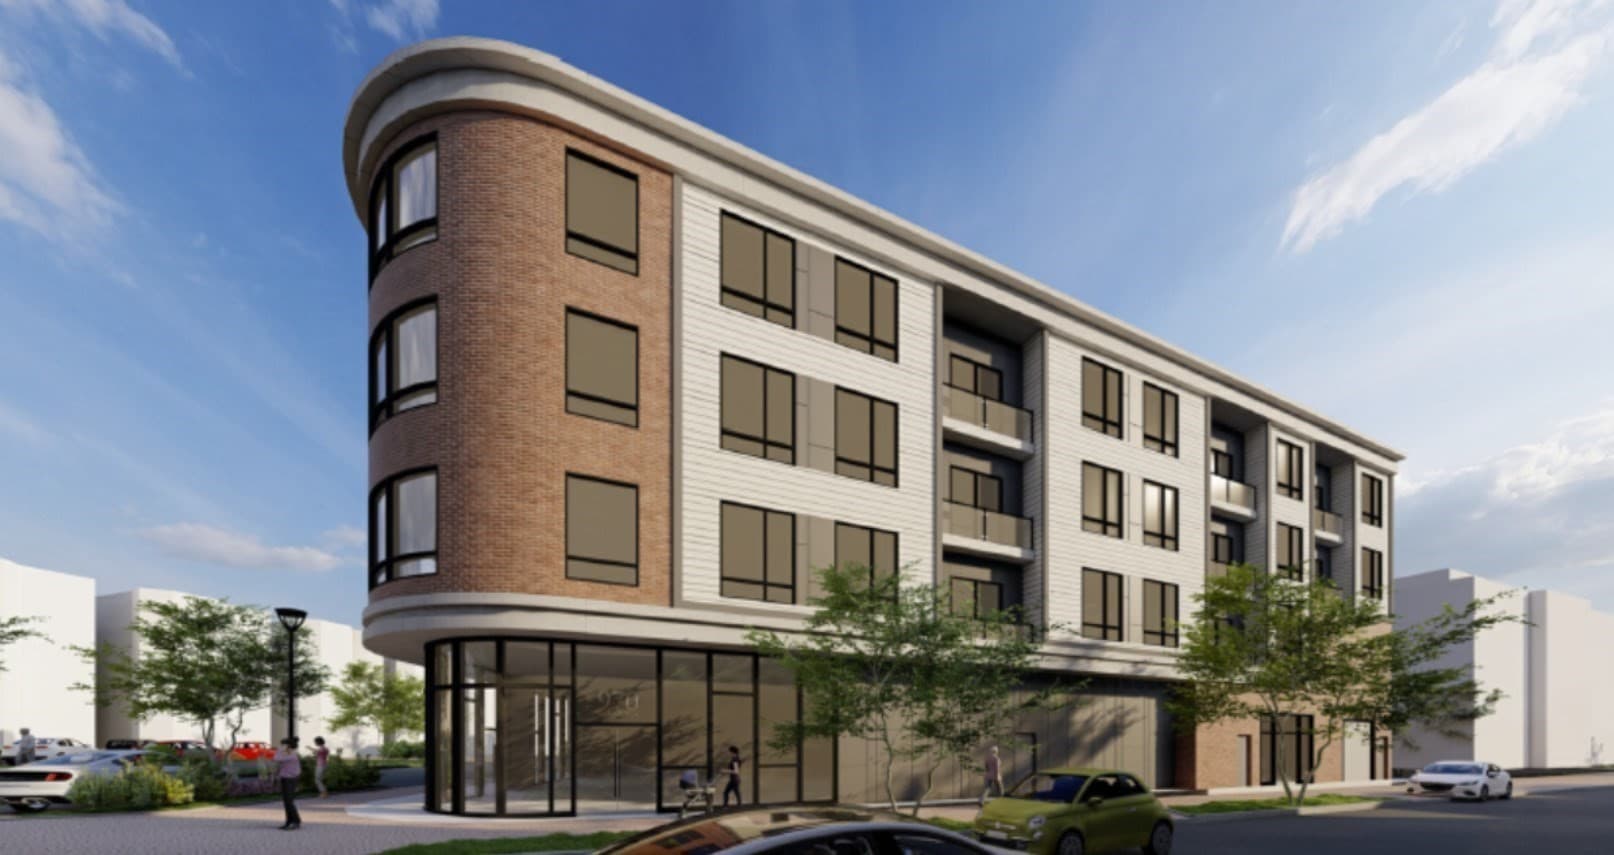
Boston Realty Advisors is pleased to present 586-598 Canterbury Street, a 46,021 SF ground-up residential development opportunity located in the Roslindale neighborhood of Boston. Situated on a 41,732 SF parcel with frontage on Canterbury Street, the approved plans call for 46 residential units with 32 on-site parking spaces, positioning much-needed housing density in one of Boston's most walkable, transit-connected, in-demand outer neighborhoods.Roslindale continues to post healthy residential fundamentals across both for-sale and rental product. Condominiums in the submarket carried a median sale price of +/-$600,000 and +/-$520 per square foot, with a median 40.5 days on market. Rental demand in Roslindale has climbed as tenant preference grows for more space, open-air, parking, and proximity to rapid transit. Rental rates in Roslindale are strong and reflective of sustained demand in a supply-constrained submarket. Taken together, the data points to a neighborhood with sustained price appreciation, tight inventory, and absorption speed well ahead of national benchmarks — a favorable backdrop for lease-up and potential condo exit alike.Canterbury Street sits within proximity to Roslindale Village, the neighborhood's commercial and civic core, and benefits from direct access to the MBTA Needham Line Commuter Rail as well as multiple bus routes connecting to Forest Hills Orange Line station offering residents immediate transit accessibility. The surrounding submarket is characterized by strong owner-occupant demand, a walkable village center, and continued reinvestment — making it an attractive target for both developers and long-term multifamily investors.
Property details
- MLS #
- 73586750
- Property type
- Commercial
- Subdivision
- N/A
- Status
- Active
- Days on market
- 14
- On market date
- September 24, 2026
- Stories
- N/A
- Total bathrooms
- N/A
- Garage spaces
- N/A
- Parking spaces
- N/A
- Lot size
- 0.96 acres
Location
Get directions →Nearby schools
Within 10 miles. School directory data from the National Center for Education Statistics (NCES), accessed via the Urban Institute Education Data API. Local Score is calculated by INNOVATE Real Estate; where a state rating is shown, it comes from that state's own official school report card (e.g. NC Dept. of Public Instruction, SC Report Card).
- Enrollment
- 359
- Student:teacher ratio
- 8.2:1
- District
- Boston
- Enrollment
- 133
- Student:teacher ratio
- 6.3:1
- District
- Boston
- Enrollment
- 525
- Student:teacher ratio
- 10.1:1
- District
- Boston
Walkability
Blended score for Boston's center, calculated by INNOVATE Real Estate from two sources: the EPA's National Walkability Index (street network, transit, land-use mix) and Google Places amenity data (what's actually reachable on foot from this point). 60% EPA National Walkability Index + 40% nearby-amenity density (Google Places).
Market position
How this listing compares to current activity in Boston, from live MLS data.
Mortgage calculator
Estimate only - actual rate and payment depend on your lender, credit, and loan program.
Adjust tax / insurance estimates
Similar homes you might like
Data source: Listing information provided by MLS Property Information Network via Trestle/CoreLogic. Last updated 3 days ago.
Information herein deemed reliable but not guaranteed; all measurements, school assignments, HOA fees, taxes, and feature lists are approximate and should be independently verified. Equal Housing Opportunity.